
Introducing ECharts Raw Card for Home Assistant
TL;DR — I built a Lovelace card that lets you write raw Apache ECharts options with live Home Assistant entity binding. No wrapper DSL, no simplified API — just the full power of one of the best charting libraries on the web, inside your dashboard.
Why I built this
I love Home Assistant. I’ve spent countless hours tweaking automations, building dashboards, and generally over-engineering my smart home. But every time I tried to visualise my data, I hit the same wall.
The built-in history graph and statistics cards are fine for a quick glance. They do the job. But the moment you want something beyond a basic line chart — a radar comparing room climates, a donut showing where your power comes from, gauges that actually look good — you’re stuck. The styling is limited, the layout options are rigid, and there’s no way to combine data from multiple entities into a single, cohesive visualisation.
I tried a few community chart cards too. They’re great projects, but most of them wrap the underlying library in a simplified YAML DSL. That’s a sensible design choice for ease of use, but it means you’re limited to whatever subset of features the card author decided to expose. Want a feature the wrapper doesn’t support? You’re out of luck.
Then I discovered Apache ECharts.
The ECharts moment
If you haven’t seen ECharts before, go spend five minutes on their examples page. Seriously. The range is staggering — line charts, bar charts, scatter plots, heatmaps, treemaps, radar charts, gauges, sankey diagrams, candlestick charts, 3D surfaces… all rendered beautifully with smooth animations and thoughtful defaults.
What struck me wasn’t just the breadth of chart types. It was the aesthetics. ECharts charts look polished out of the box. The gradients, the tooltips, the dark theme — everything feels considered. And the configuration is incredibly granular. Every axis, every series, every label can be tuned exactly how you want.
I knew immediately: I needed this in Home Assistant.
The approach: no abstraction
The key design decision was to not build an abstraction layer. You write a real ECharts option object in your card YAML, exactly as the ECharts docs describe it. If ECharts supports it, you can use it. Period.
But raw chart options alone aren’t useful in a dashboard — you need live data. So the card introduces a small set of tokens that resolve Home Assistant data into the chart at render time:
$entity— bind any entity’s state (or attribute) into any position in the chart config$data— turn a list of entities into chart-ready data (pairs, names, or values)$history— fetch historical data with automatic downsampling and caching
That’s it. The tokens handle the HA integration, ECharts handles the visualisation. No new DSL to learn — if you can read the ECharts docs, you can build the chart.
What it looks like
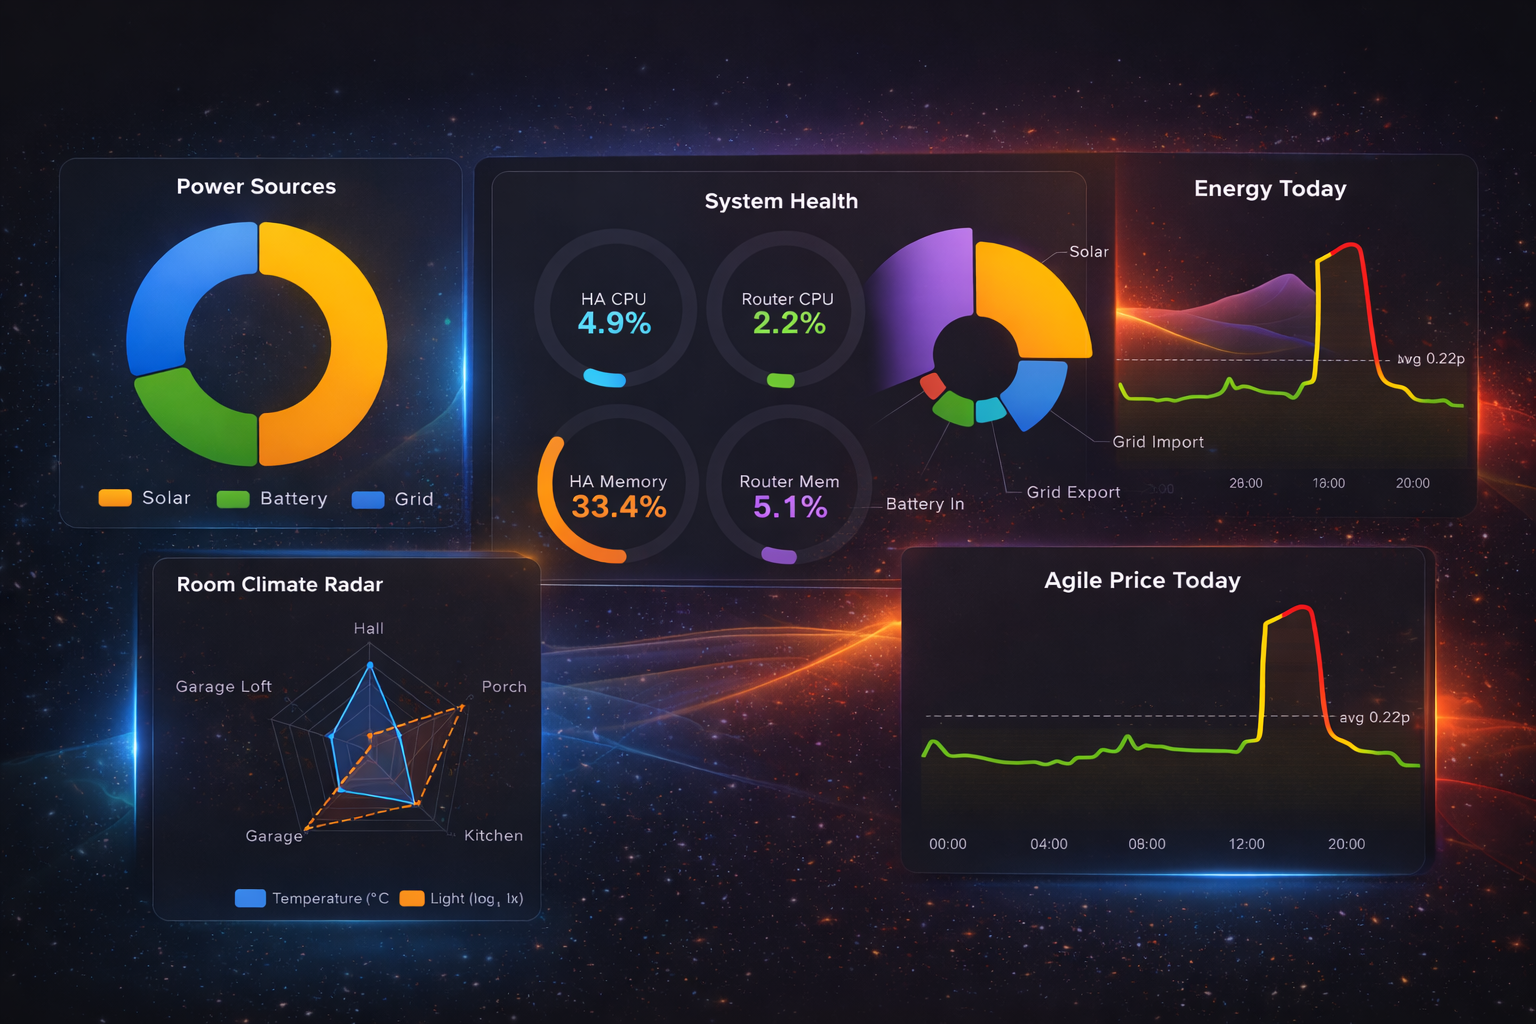
Here are a few examples running on my actual dashboard:
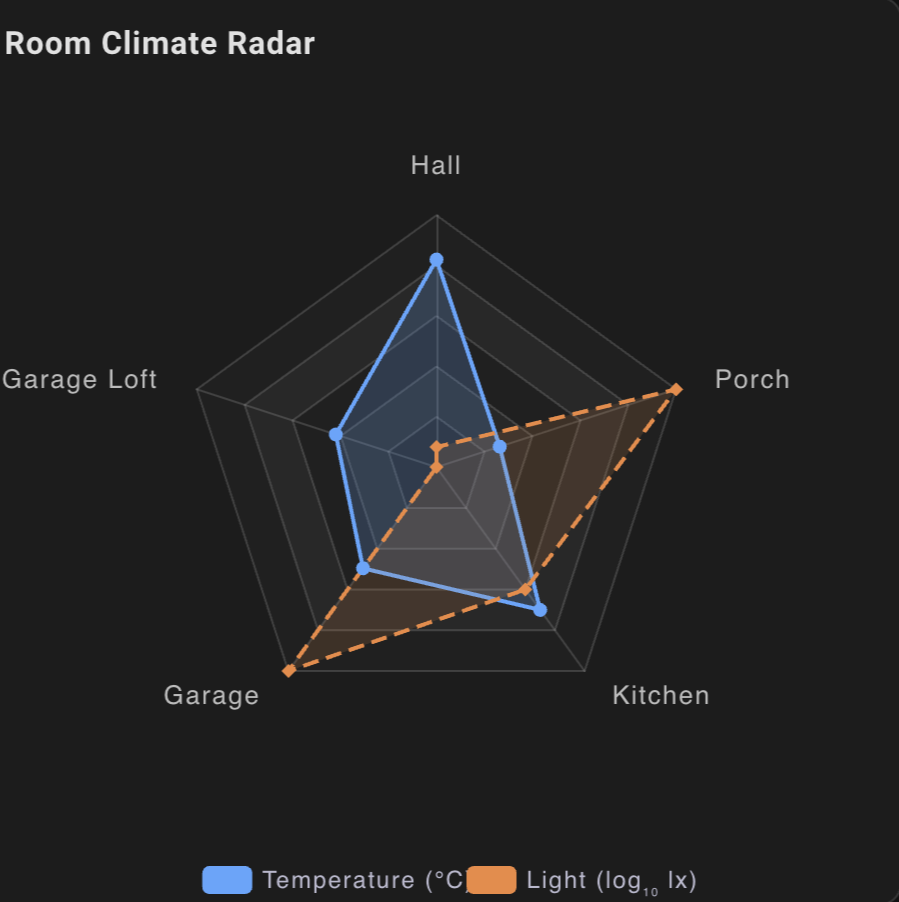 Radar — five rooms, temperature and light levels on a single radar chart. The light values use a log transform so they don’t blow out the scale.
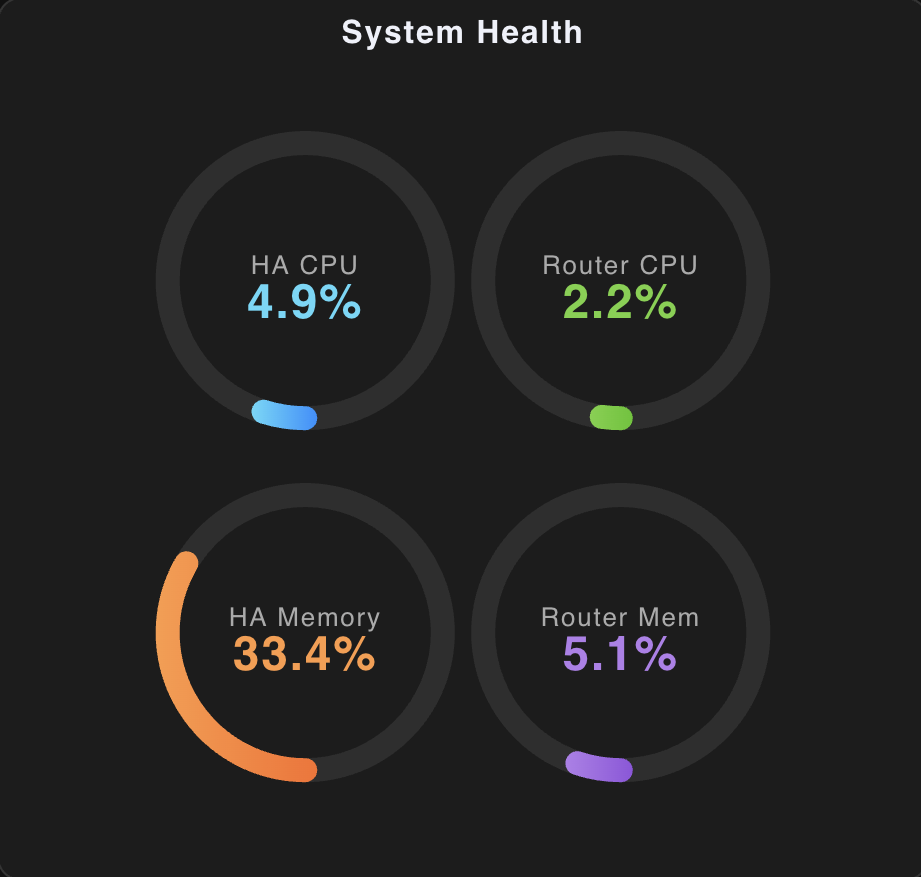 Gauges — CPU and memory for my HA server and router. Ring-style gauges with gradient fills, all driven by
 $entity tokens.
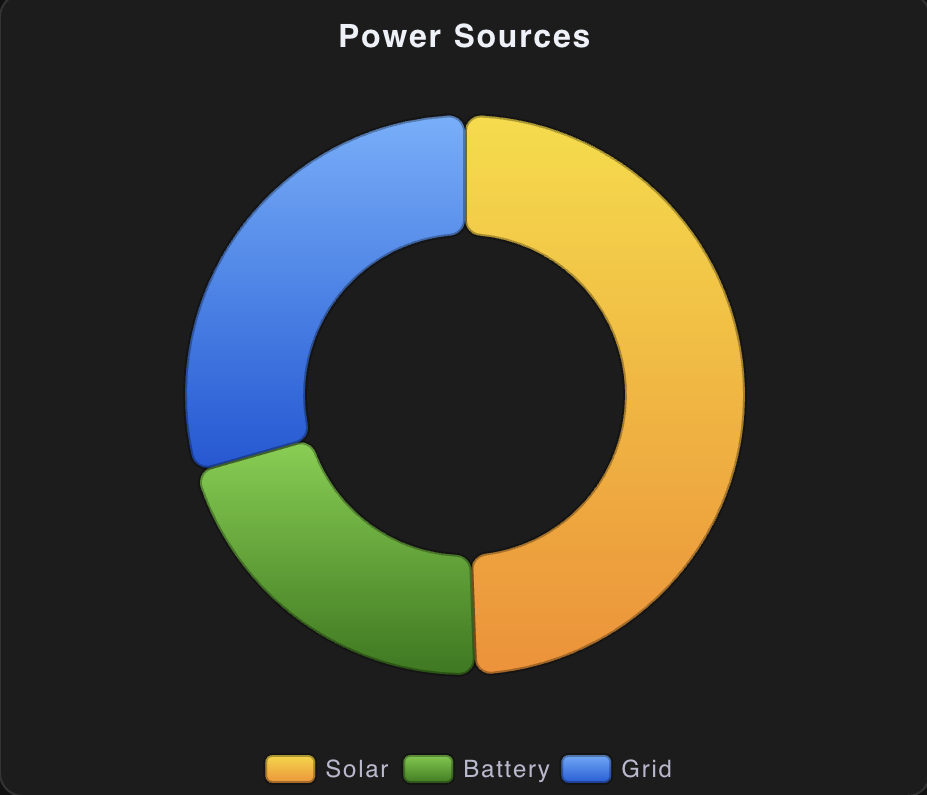 Donut — where my power comes from right now. Solar, battery, and grid as a simple donut with a legend.
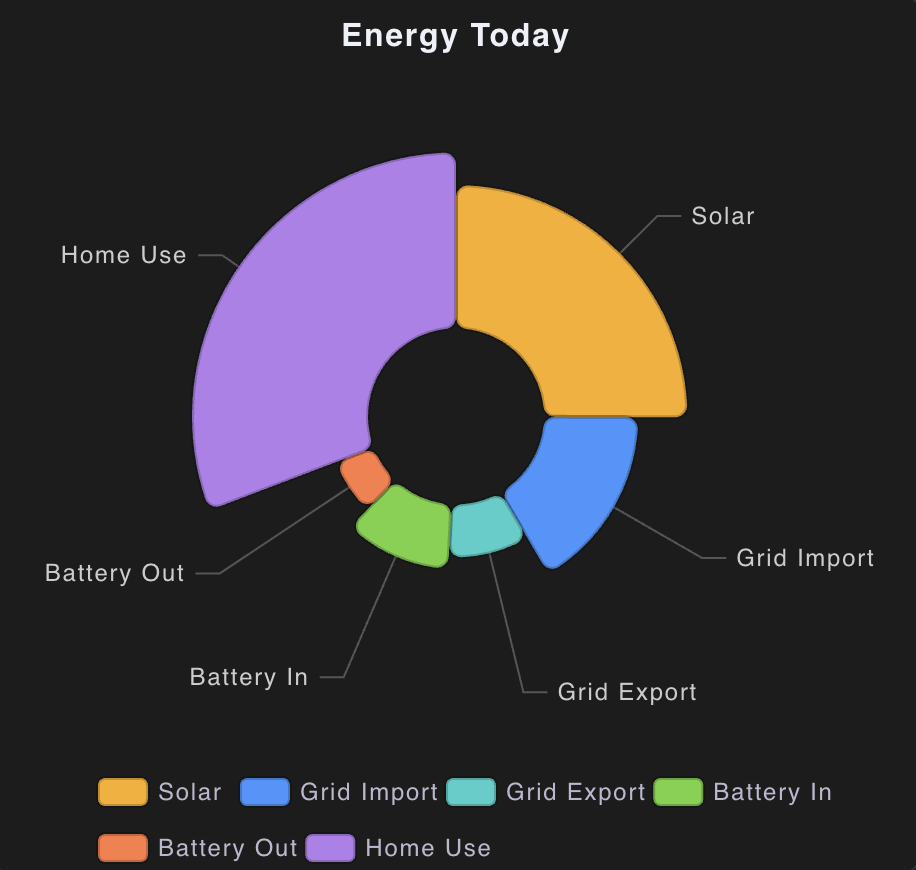 Nightingale Rose — energy breakdown by category. A rose chart is essentially a pie chart where the radius encodes the value instead of the angle. It looks gorgeous.
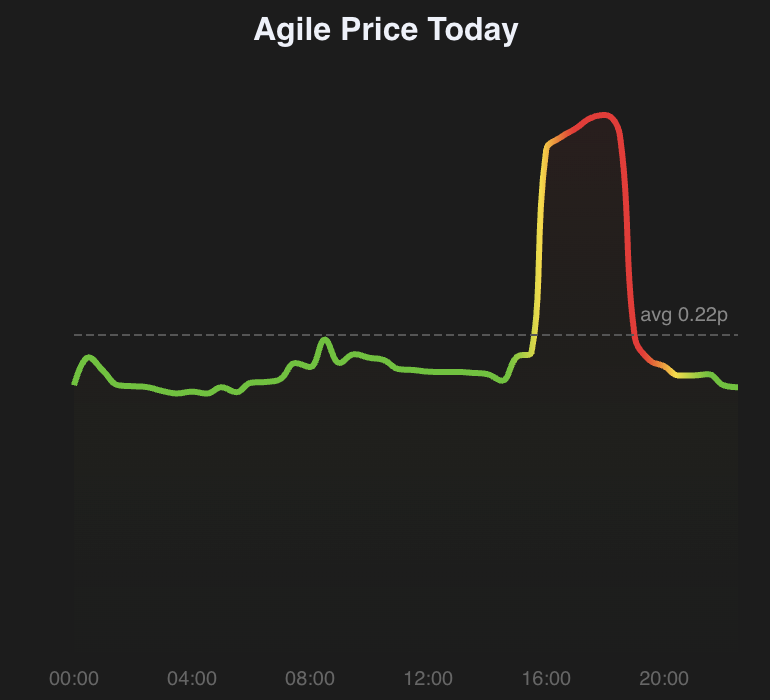 Agile Pricing — Octopus Energy half-hourly rates as a smooth area chart with a colour gradient from green (cheap) through yellow to red (expensive). A dynamic average line updates as rates change.
Every one of these is a single Lovelace card config. No custom templates, no AppDaemon scripts, no Node-RED flows. Just YAML and ECharts.
Key features
- Full Apache ECharts
optionsupport — anything ECharts can render, this card can render - Live entity binding with coercion, transforms, and attribute reading
- Historical data with automatic downsampling and LRU caching
- Automatic dark/light mode switching
- Canvas or SVG renderer
- Installs via HACS
Getting started
Install via HACS as a custom repository (category: Lovelace), add the resource, and start building. The documentation site has full reference docs and the YAML for every chart shown above.
The GitHub repo has the source, CI, and tests. PRs and issues welcome.
What’s next
I have a backlog of chart types I want to showcase — heatmaps for presence detection, sankey diagrams for energy flow, treemaps for disk usage. The beauty of the raw approach is that none of these need card changes — they’re just new ECharts configs.
If you’ve been wanting more from your Home Assistant dashboards, give it a try. I think you’ll be surprised how much is possible when you stop fighting a wrapper and just write the chart you want.